
We have been using so called forecast hit-rate to measure how well the Scrum Teams are able to predict their velocity. It's the result of dividing planned number of Story Points with the actually realized number of Story Points for a Sprint. But in case the number of stories is small, there's easily large deviations when things don't perfectly as planned. And usually things don't go perfectly as planned.
Also this measure can result in some rather nasty dysfunctions. Teams start to favor keeping the forecast instead of trying to maximize the amount of customer value in a Sprint. Or even though some Story becomes obsolete it isn't dropped because that would flaw the statistics. This isn't nice.

We use Atlassian JIRA and JIRA Agile for our Backlogs and Scrum boards. (I guess I should start calling it JIRA Software soon.) It offers a handy Velocity Chart where one can follow these planned vs. completed results. This is essentially the source of our forecast hit-rate information.
But due to all the possible events that affect the Scrum Teams and the #NoEstimates movement that gains momentum also in our company, the data has a really high variance. Even after couple of years it shows no signs of stabilizing. (Of course it can argued that is a systemic dysfunction. As it is. But let's not go there.)

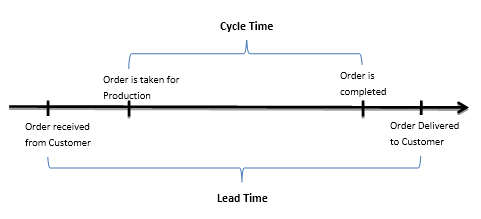
Another tempting alternative for this metric that I've been thinking about is Cycle Time. Average time that a Backlog item takes between the start of work until it is completed. Let's assume that such metric would be easily available and that there would be target on it or that management would follow the number. What kind of behavior would this drive?
My assumption is that it would make the Stories smaller. That teams would strive to get things done faster instead of having mammoth size stories. So In the end there would be a bigger number of smaller Stories and tasks that could be made in shorter time. I would like that. Also it would fit nicely with #NoEstimates.
Since this is still simply hypothetical, I don't have any results yet. But this is an experiment that I'm about to try.

I would be interested to hear your results.
ReplyDeletePersonally, having a decent Scrum Master on board to help the Team (including PO) break it all down works.
After all, I have only been doing this for 12 years without a failure, but my big head aside - any new tools in my armoury would be most graciously accepted.
I mean it, I don't know all.
Hi Craig.
DeleteThanks for the first ever comment. :)
I'll be happy to come back with the results. In my experience unfortunately the metrics don't guarantee anything. There are teams that look good in metrics, but the product doesn't have many users. And then there are horribly functioning teams, but the product just sells like hell. Same applies for quality. Some teams produce nice looking clean code, the others horrible spaghetti, but in the end customers only care about the perceived quality. Not that much about how good things look under the hood. (Developers usually have different view. ;) )
Hi Kathy.
ReplyDeleteYes, we are using JIRA and it can provide a Cumulative Flow Diagram. But lately I've been even more interested in the Control Chart (https://confluence.atlassian.com/agile/jira-agile-user-s-guide/using-a-board/using-reports/viewing-the-control-chart) There I can directly see how the cycle time is developing.
...And true, in the end it's all about getting working software out. Doing things faster but with inferior quality does not sound tempting. So let's see how things turn out.