I selected the average Cycle Time during past month as the metric for each team. In a way it is a good metric and gives indication about how quickly the value was realized after the work on a backlog item was started. But all backlog items aren't equal and also work type and intensity differ during the release cycle. In the beginning of the release cycle teams mostly work on the new development. Nearing the end the period emphasis is shifted more towards testing and bug fixing. Issue life cycle tends to be much shorter with bugs than when creating new functionality.

It is also questionable if one monthly average number can help in decision making, in essence serve as an actionable metric. You can see the trends in longer time intervals, not much more than that. Another angle is that a team can be really mature and produce outstanding results even though they don't split their Stories into very small parts. Their average deviation can be small and thus predictability high.
Then again I feel that the metric got a little unfair criticism when it was compared with Lead Time. In the end the company is interested in how the customers experience our products and services (Customer Experience = CX). But this includes many topics that are out of scope for software development. Like the company brand(s), how salesmen conduct their business and how the customers are served by the customer service. I think the software development part of the system (company) can greatly affect the User Experience (UX).

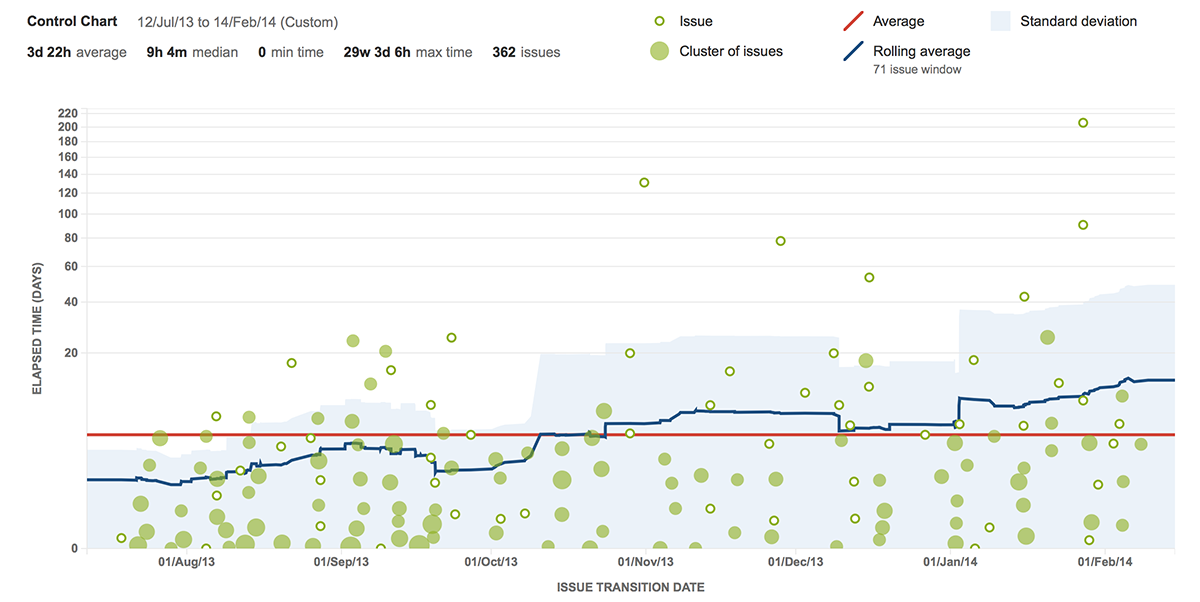
Now the current bleeding edge is to try using the whole information provided by the JIRA Control Chart instead of simply one number. I haven't yet figured any cons, but on the pro side you get trend lines of where the performance is developing and standard deviations. Of course you can still identify the release cycle from this data, but you can draw other conclusions too. Increases in rolling average or standard deviation can signal trouble. And when the figures are followed regularly, the team can be aided in a timely fashion.